Genius can also plot surfaces. Select the Surface plot tab in the
main notebook of the Create Plot window. Here you can specify a single
expression that should use either x and y as real independent variables
or z as a complex variable (where x is the real part of z and y is the
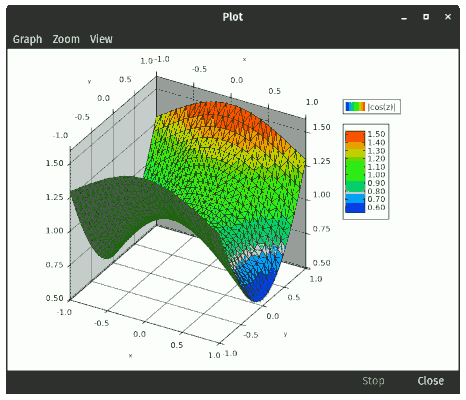
imaginary part). For example to plot the modulus of the cosine
function for complex parameters,
you could enter |cos(z)|. This would be
equivalent to |cos(x+1i*y)|.
See Figure 4.5, “Surface Plot”.
For plotting using the command line see the documentation of the
SurfacePlot function.
The z range can be set automatically by turning on the Fit dependent axis
checkbox. The variables can be renamed by clicking the Change variable names... button, which is useful if you wish to print or save the figure and don't want to use the standard
names. Finally you can also avoid printing the legend, which is also useful if printing or
saving, when the legend might simply be clutter.
In surface mode, left and right arrow keys on your keyboard will rotate the view along the z axis. Alternatively you can rotate along any axis by selecting Rotate axis... in the View menu. The View menu also has a top view mode which rotates the graph so that the z axis is facing straight out, that is, we view the graph from the top and get essentially just the colors that define the values of the function getting a temperature plot of the function. Finally you should try Start rotate animation, to start a continuous slow rotation. This is especially good if using Genius Mathematics Tool to present to an audience.