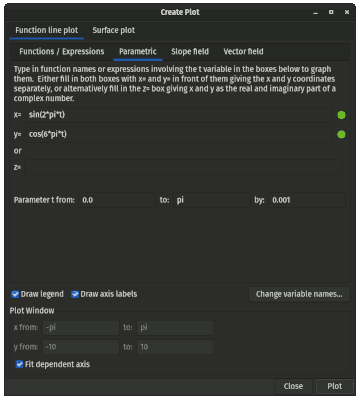
In the create plot window, you can also choose the Parametric notebook
tab to create two dimensional parametric plots. This way you can
plot a single parametric function. You can either specify the
points as x and y, or giving a single complex number
as a function of the variable t.
The range of the variable t is given explicitly, and the function is sampled
according to the given increment.
The x and y range can be set
automatically by turning on the Fit dependent axis
checkbox, or it can be specified explicitly.
See Figure 4.3, “Parametric Plot Tab”.
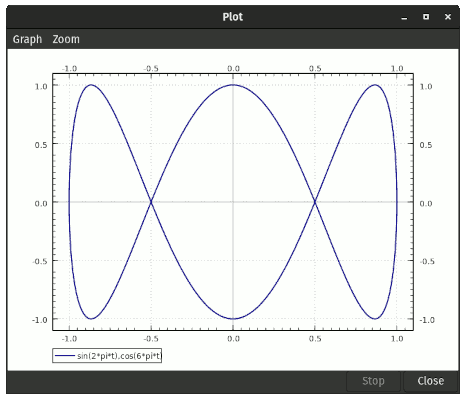
An example of a parametric plot is given in
Figure 4.4, “Parametric Plot”.
Similar operations can be
done on such graphs as can be done on the other line plots.
For plotting using the command line see the documentation of the
LinePlotParametric or
LinePlotCParametric function.